Coastal Property Price Index · H2 2025
Seaside house prices, measured.
Every Land Registry sale on the coast of England and Wales since 2019, turned into one index. Updated every six months. Free to use with a credit.
The headline
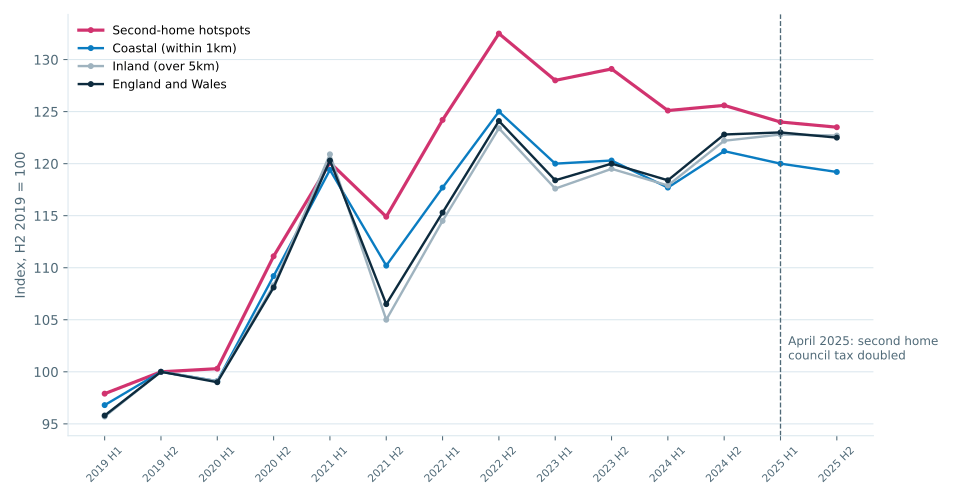
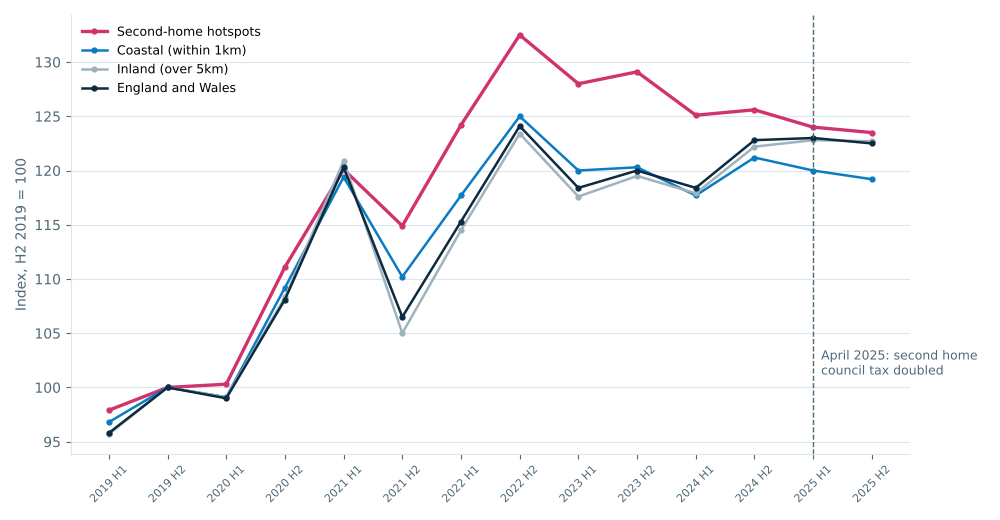
Second-home hotspots are falling. The rest of the country isn’t.
In the first full six months since councils doubled council tax on second homes, prices in the best-known second-home towns fell while inland prices stood still.
| Half-year | Second-home hotspots | Coastal (within 1km) | Inland (over 5km) | England and Wales |
|---|---|---|---|---|
| 2019 H1 | 97.9 | 96.8 | 95.7 | 95.8 |
| 2019 H2 | 100.0 | 100.0 | 100.0 | 100.0 |
| 2020 H1 | 100.3 | 99.1 | 99.1 | 99.0 |
| 2020 H2 | 111.1 | 109.2 | 108.3 | 108.1 |
| 2021 H1 | 120.1 | 119.4 | 120.9 | 120.3 |
| 2021 H2 | 114.9 | 110.2 | 105.0 | 106.5 |
| 2022 H1 | 124.2 | 117.7 | 114.5 | 115.3 |
| 2022 H2 | 132.5 | 125.0 | 123.4 | 124.1 |
| 2023 H1 | 128.0 | 120.0 | 117.6 | 118.4 |
| 2023 H2 | 129.1 | 120.3 | 119.5 | 120.0 |
| 2024 H1 | 125.1 | 117.7 | 117.9 | 118.4 |
| 2024 H2 | 125.6 | 121.2 | 122.2 | 122.8 |
| 2025 H1 | 124.0 | 120.0 | 122.8 | 123.0 |
| 2025 H2 | 123.5 | 119.2 | 122.7 | 122.5 |
Second-home towns
Padstow, Rye, Lyme Regis: down a fifth, a sixth, a seventh.
Median sale price in 41 well-known second-home towns, July to December 2025 against the same months a year earlier. Click a column heading to sort.
| Town | County | Sales | Median price | 1 year | 2 years | 5 years |
|---|---|---|---|---|---|---|
| Bembridge | Isle of Wight | 38 | £322,500 | -34.2% | -28.7% | 0.0% |
| Padstow | Cornwall | 32 | £457,500 | -20.7% | -37.1% | +8.9% |
| Rye | East Sussex | 125 | £365,000 | -16.6% | -8.7% | +8.6% |
| Lyme Regis | Dorset | 46 | £505,000 | -14.6% | -7.0% | +35.4% |
| Holt | Norfolk | 93 | £352,000 | -13.9% | -17.2% | +2.0% |
| Cardigan | Ceredigion | 97 | £220,000 | -12.0% | -15.5% | +20.2% |
| Sheringham | Norfolk | 71 | £302,500 | -11.7% | -13.6% | -4.0% |
| Milford Haven | Pembrokeshire | 146 | £170,000 | -10.5% | +9.7% | +25.5% |
| Alnwick | Northumberland | 143 | £285,000 | -9.4% | +12.0% | +31.9% |
| Pembroke | Pembrokeshire | 72 | £210,000 | -6.7% | 0.0% | +23.6% |
| Newquay | Cornwall | 401 | £315,000 | -6.3% | -3.1% | +27.4% |
| Falmouth | Cornwall | 248 | £341,998 | -6.3% | -7.6% | +20.0% |
| Whitby | North Yorkshire | 181 | £265,000 | -5.4% | 0.0% | +29.9% |
| Whitstable | Kent | 266 | £402,500 | -5.3% | +0.6% | +17.5% |
| Bude | Cornwall | 140 | £362,500 | -4.9% | -2.0% | +26.9% |
| Swanage | Dorset | 98 | £363,750 | -4.3% | -14.2% | +5.4% |
| Saltburn-By-The-Sea | Redcar and Cleveland | 233 | £165,000 | -3.2% | -1.8% | +24.1% |
| Kingsbridge | Devon | 178 | £412,750 | -2.9% | +2.3% | +28.7% |
| Cromer | Norfolk | 119 | £282,500 | -2.6% | -9.9% | +4.6% |
| Southwold | Suffolk | 44 | £487,500 | -2.5% | -13.9% | +14.7% |
| Penzance | Cornwall | 289 | £285,000 | -1.7% | 0.0% | +21.3% |
| Totnes | Devon | 185 | £410,050 | -1.7% | -4.6% | +23.5% |
| Helston | Cornwall | 227 | £315,000 | -1.6% | +4.1% | +26.0% |
| Haverfordwest | Pembrokeshire | 242 | £226,500 | -1.5% | -9.4% | +14.0% |
| Braunton | Devon | 93 | £420,000 | -1.4% | 0.0% | +37.7% |
| Bridport | Dorset | 203 | £375,000 | -1.3% | -4.8% | +31.6% |
| Tenby | Pembrokeshire | 84 | £256,750 | -1.2% | -11.1% | +8.3% |
| Wadebridge | Cornwall | 112 | £350,000 | 0.0% | -11.4% | +9.4% |
| Sidmouth | Devon | 191 | £405,000 | +1.2% | +2.5% | +15.7% |
| Teignmouth | Devon | 189 | £325,000 | +1.6% | -2.8% | +24.0% |
| Looe | Cornwall | 101 | £280,000 | +1.6% | +0.9% | +24.4% |
| Saundersfoot | Pembrokeshire | 42 | £306,250 | +3.8% | -4.3% | +25.0% |
| Brixham | Torbay | 162 | £292,500 | +5.4% | -2.5% | +27.5% |
| Hayle | Cornwall | 120 | £297,014 | +6.1% | -5.7% | +21.0% |
| Dawlish | Devon | 151 | £285,000 | +8.6% | +1.4% | +24.6% |
| Wareham | Dorset | 147 | £385,000 | +9.2% | -3.7% | +29.4% |
| Budleigh Salterton | Devon | 62 | £460,000 | +10.8% | +4.2% | +35.3% |
| Beaminster | Dorset | 60 | £352,000 | +11.7% | -2.2% | +35.4% |
| Pwllheli | Gwynedd | 112 | £276,000 | +13.8% | -8.0% | +36.3% |
| Dartmouth | Devon | 71 | £420,000 | +18.3% | +15.4% | +14.6% |
| Fowey | Cornwall | 42 | £472,500 | +26.0% | +26.0% | +47.7% |
Towns with fewer than 30 sales in either period are left out. Under about 50 sales a half-year the median can move on a handful of houses, so read the small towns alongside the pooled figure above.
Seaside towns rising and falling
133 seaside towns. Find yours.
Every town where at least half of sales are within 2km of the sea and there were at least 100 sales in the half-year. Sorted by the past year’s change; click any heading to re-sort.
Rising fastest
- Broadstairs+13.8%
- Pwllheli+13.8%
- Llandudno+11.6%
- Barton-Upon-Humber+10.8%
- North Shields+10.8%
- Birkenhead+10.0%
- Sandown+9.3%
- Wallasey+9.3%
- Wareham+9.2%
- Dawlish+8.6%
Most expensive
- Lymington£520,000
- Hove£455,000
- Christchurch£420,000
- Shoreham-By-Sea£419,500
- Brighton£415,000
- Leigh-On-Sea£410,000
- Sidmouth£405,000
- Whitstable£402,500
Least expensive
- Peterlee£85,000
- Seaham£125,000
- Fleetwood£127,000
- Blackpool£136,000
- Maryport£142,500
- Birkenhead£143,000
- Blyth£150,000
- Hartlepool£154,700
| Town | County | Sales | Median price | A year earlier | 1 year | 5 years |
|---|---|---|---|---|---|---|
| Rye | East Sussex | 125 | £365,000 | £437,500 | -16.6% | +8.6% |
| Grange-Over-Sands | Westmorland and Furness | 103 | £275,000 | £319,500 | -13.9% | +10.9% |
| Deal | Kent | 315 | £295,000 | £340,000 | -13.2% | +13.5% |
| Neston | Cheshire West and Chester | 173 | £300,000 | £341,000 | -12.0% | +20.5% |
| Maryport | Cumberland | 122 | £142,500 | £160,000 | -10.9% | +30.7% |
| Seaham | County Durham | 211 | £125,000 | £140,000 | -10.7% | +8.7% |
| Milford Haven | Pembrokeshire | 146 | £170,000 | £189,999 | -10.5% | +25.5% |
| Frinton-On-Sea | Essex | 180 | £330,248 | £365,000 | -9.5% | +11.2% |
| Filey | North Yorkshire | 155 | £195,000 | £215,000 | -9.3% | +18.9% |
| Paignton | Torbay | 416 | £255,000 | £279,995 | -8.9% | +23.3% |
| Bexhill-On-Sea | East Sussex | 408 | £312,250 | £340,000 | -8.2% | +13.5% |
| Aberystwyth | Ceredigion | 151 | £210,000 | £225,500 | -6.9% | +13.5% |
| Eastbourne | East Sussex | 924 | £280,000 | £300,000 | -6.7% | +12.0% |
| Newquay | Cornwall | 401 | £315,000 | £336,250 | -6.3% | +27.4% |
| Falmouth | Cornwall | 248 | £341,998 | £365,000 | -6.3% | +20.0% |
| Blyth | Northumberland | 287 | £150,000 | £160,000 | -6.2% | +27.1% |
| Chepstow | Monmouthshire | 178 | £320,000 | £339,998 | -5.9% | +6.7% |
| Fleetwood | Lancashire | 187 | £127,000 | £135,000 | -5.9% | +4.5% |
| Mablethorpe | Lincolnshire | 108 | £188,748 | £200,000 | -5.6% | +25.0% |
| Carnforth | Lancashire | 249 | £285,000 | £302,000 | -5.6% | +27.4% |
| Whitby | North Yorkshire | 181 | £265,000 | £280,000 | -5.4% | +29.9% |
| Whitstable | Kent | 266 | £402,500 | £425,000 | -5.3% | +17.5% |
| Worthing | West Sussex | 938 | £355,375 | £375,000 | -5.2% | +19.1% |
| Havant | Hampshire | 315 | £280,000 | £295,000 | -5.1% | +27.3% |
| Bude | Cornwall | 140 | £362,500 | £381,250 | -4.9% | +26.9% |
| Emsworth | Hampshire | 175 | £402,500 | £421,250 | -4.5% | +11.0% |
| Torquay | Torbay | 512 | £230,000 | £240,000 | -4.2% | +20.4% |
| Margate | Kent | 306 | £278,750 | £290,000 | -3.9% | +26.7% |
| Stanford-Le-Hope | Thurrock | 248 | £365,000 | £380,000 | -3.9% | +22.9% |
| Brough | East Riding of Yorkshire | 242 | £245,000 | £255,000 | -3.9% | +26.6% |
| Exmouth | Devon | 310 | £325,000 | £338,250 | -3.9% | +18.2% |
| Seaton | Devon | 112 | £310,500 | £322,500 | -3.7% | +19.9% |
| Colwyn Bay | Conwy | 315 | £216,950 | £225,000 | -3.6% | +24.0% |
| Clevedon | North Somerset | 185 | £350,000 | £362,601 | -3.5% | +18.6% |
| Portland | Dorset | 129 | £231,500 | £240,000 | -3.5% | +21.8% |
| Scarborough | North Yorkshire | 697 | £193,000 | £199,725 | -3.4% | +24.5% |
| Saltburn-By-The-Sea | Redcar and Cleveland | 233 | £165,000 | £170,500 | -3.2% | +24.1% |
| Birchington | Kent | 137 | £315,000 | £325,000 | -3.1% | +14.5% |
| Bournemouth | Bournemouth, Christchurch and Poole | 1,423 | £310,000 | £320,000 | -3.1% | +19.2% |
| Peacehaven | East Sussex | 175 | £340,000 | £350,000 | -2.9% | +14.2% |
| Seaford | East Sussex | 228 | £369,000 | £380,000 | -2.9% | +15.9% |
| Abergele | Conwy | 170 | £210,000 | £215,750 | -2.7% | +38.2% |
| Cromer | Norfolk | 119 | £282,500 | £290,000 | -2.6% | +4.6% |
| Sunderland | Tyne and Wear | 1,096 | £157,000 | £161,000 | -2.5% | +21.0% |
| Weymouth | Dorset | 593 | £287,500 | £295,000 | -2.5% | +21.6% |
| Redcar | Redcar and Cleveland | 353 | £168,500 | £172,500 | -2.3% | +29.6% |
| Harwich | Essex | 183 | £250,000 | £255,750 | -2.2% | +35.1% |
| Fareham | Hampshire | 864 | £335,000 | £342,000 | -2.0% | +18.2% |
| Portsmouth | Portsmouth | 782 | £255,000 | £260,000 | -1.9% | +18.6% |
| Ramsgate | Kent | 361 | £275,000 | £280,000 | -1.8% | +19.6% |
| Penzance | Cornwall | 289 | £285,000 | £290,000 | -1.7% | +21.3% |
| Barrow-In-Furness | Westmorland and Furness | 426 | £156,500 | £159,250 | -1.7% | +23.2% |
| Whitehaven | Cumberland | 254 | £158,500 | £161,000 | -1.6% | +12.4% |
| Maldon | Essex | 325 | £375,000 | £380,000 | -1.3% | +21.0% |
| Southport | Merseyside | 804 | £225,000 | £227,750 | -1.2% | +25.8% |
| Peterlee | County Durham | 246 | £85,000 | £85,999 | -1.2% | +11.8% |
| Cleethorpes | North East Lincolnshire | 250 | £160,000 | £162,000 | -1.2% | +19.4% |
| Ryde | Isle of Wight | 254 | £252,500 | £255,000 | -1.0% | +26.2% |
| Minehead | Somerset | 169 | £290,600 | £292,500 | -0.6% | +15.1% |
| Sittingbourne | Kent | 606 | £312,000 | £313,500 | -0.5% | +24.8% |
| Christchurch | Bournemouth, Christchurch and Poole | 531 | £420,000 | £421,500 | -0.4% | +14.1% |
| Widnes | Halton | 403 | £195,500 | £196,000 | -0.3% | +23.1% |
| Bridlington | East Riding of Yorkshire | 387 | £184,500 | £185,000 | -0.3% | +29.5% |
| Great Yarmouth | Norfolk | 804 | £230,000 | £230,000 | 0.0% | +22.3% |
| Wadebridge | Cornwall | 112 | £350,000 | £350,000 | 0.0% | +9.4% |
| Port Talbot | Neath Port Talbot | 308 | £155,000 | £155,000 | 0.0% | +34.8% |
| Southampton | Hampshire | 3,177 | £310,000 | £310,000 | 0.0% | +17.4% |
| Saltash | Cornwall | 165 | £265,000 | £264,995 | 0.0% | +25.9% |
| Gosport | Hampshire | 528 | £250,000 | £250,000 | 0.0% | +23.2% |
| Morecambe | Lancashire | 423 | £185,000 | £185,000 | 0.0% | +31.7% |
| Hastings | East Sussex | 377 | £300,000 | £300,000 | 0.0% | +20.0% |
| Herne Bay | Kent | 334 | £330,000 | £330,000 | 0.0% | +10.0% |
| Workington | Cumberland | 311 | £160,000 | £160,000 | 0.0% | +18.5% |
| Caldicot | Monmouthshire | 166 | £307,500 | £307,500 | 0.0% | +24.5% |
| Newhaven | East Sussex | 105 | £292,000 | £291,750 | +0.1% | +16.8% |
| Lowestoft | Suffolk | 584 | £230,000 | £229,250 | +0.3% | +27.8% |
| Skegness | Lincolnshire | 244 | £190,000 | £189,310 | +0.4% | +24.2% |
| Leigh-On-Sea | Southend-On-Sea | 459 | £410,000 | £407,250 | +0.7% | +17.2% |
| Littlehampton | West Sussex | 617 | £335,000 | £332,496 | +0.8% | +18.8% |
| Bognor Regis | West Sussex | 609 | £325,000 | £322,000 | +0.9% | +16.1% |
| Holyhead | Isle of Anglesey | 146 | £197,500 | £195,500 | +1.0% | +19.7% |
| Clacton-On-Sea | Essex | 578 | £250,000 | £247,500 | +1.0% | +13.6% |
| Blackpool | Blackpool | 1,058 | £136,000 | £134,500 | +1.1% | +15.3% |
| Sidmouth | Devon | 191 | £405,000 | £400,000 | +1.2% | +15.7% |
| Folkestone | Kent | 559 | £310,000 | £306,000 | +1.3% | +34.5% |
| Burnham-On-Sea | Somerset | 175 | £280,000 | £276,000 | +1.4% | +19.1% |
| Lancing | West Sussex | 216 | £350,000 | £345,000 | +1.4% | +25.0% |
| Poole | Bournemouth, Christchurch and Poole | 1,139 | £335,000 | £330,000 | +1.5% | +16.7% |
| Teignmouth | Devon | 189 | £325,000 | £320,000 | +1.6% | +24.0% |
| Hythe | Kent | 194 | £398,750 | £392,500 | +1.6% | +27.4% |
| Rhyl | Denbighshire | 341 | £183,000 | £180,000 | +1.7% | +30.2% |
| Brighton | Brighton and Hove | 1,427 | £415,000 | £407,500 | +1.8% | +21.0% |
| Sheerness | Kent | 267 | £280,000 | £275,000 | +1.8% | +24.4% |
| Plymouth | City of Plymouth | 2,233 | £235,000 | £230,000 | +2.2% | +26.3% |
| Barry | The Vale of Glamorgan | 470 | £235,000 | £229,750 | +2.3% | +38.2% |
| Bangor | Gwynedd | 145 | £181,000 | £177,000 | +2.3% | +24.8% |
| Shoreham-By-Sea | West Sussex | 173 | £419,500 | £410,000 | +2.3% | +16.2% |
| Prestatyn | Denbighshire | 201 | £185,000 | £180,000 | +2.8% | +20.5% |
| Cowes | Isle of Wight | 148 | £298,250 | £290,000 | +2.8% | +35.9% |
| Canvey Island | Essex | 253 | £324,000 | £315,000 | +2.9% | +23.4% |
| Southsea | Portsmouth | 501 | £264,000 | £256,500 | +2.9% | +20.0% |
| Hartlepool | Hartlepool | 747 | £154,700 | £150,000 | +3.1% | +23.8% |
| Felixstowe | Suffolk | 268 | £295,000 | £285,000 | +3.5% | +18.0% |
| Wirral | Merseyside | 1,458 | £259,845 | £250,000 | +3.9% | +33.3% |
| Thornton-Cleveleys | Lancashire | 531 | £177,000 | £170,000 | +4.1% | +28.3% |
| Hayling Island | Hampshire | 165 | £370,000 | £354,912 | +4.3% | +16.4% |
| Hove | Brighton and Hove | 654 | £455,000 | £435,000 | +4.6% | +19.9% |
| Penarth | The Vale of Glamorgan | 260 | £351,500 | £336,000 | +4.6% | +27.8% |
| Porthcawl | Bridgend | 155 | £325,000 | £310,000 | +4.8% | +30.0% |
| Westcliff-On-Sea | Southend-On-Sea | 290 | £315,000 | £300,000 | +5.0% | +19.1% |
| Manningtree | Essex | 181 | £370,000 | £352,500 | +5.0% | +23.3% |
| Lytham St Annes | Lancashire | 489 | £260,000 | £246,950 | +5.3% | +21.8% |
| St Leonards-on-sea | East Sussex | 386 | £283,500 | £269,250 | +5.3% | +27.3% |
| Brixham | Torbay | 162 | £292,500 | £277,500 | +5.4% | +27.5% |
| Ilfracombe | Devon | 136 | £257,000 | £243,500 | +5.5% | +13.1% |
| Runcorn | Halton | 359 | £190,000 | £180,000 | +5.6% | +29.7% |
| Whitley Bay | Tyne and Wear | 437 | £315,000 | £297,475 | +5.9% | +44.2% |
| Llanelli | Carmarthenshire | 502 | £179,972 | £170,000 | +5.9% | +34.3% |
| Hessle | East Riding of Yorkshire | 157 | £210,000 | £197,000 | +6.6% | +15.4% |
| Lymington | Hampshire | 314 | £520,000 | £487,500 | +6.7% | +22.7% |
| Southend-On-Sea | Southend-On-Sea | 640 | £345,000 | £322,500 | +7.0% | +25.5% |
| Berwick-Upon-Tweed | Northumberland | 141 | £202,000 | £188,188 | +7.3% | +39.3% |
| South Shields | Tyne and Wear | 410 | £157,250 | £145,000 | +8.4% | +24.8% |
| Dawlish | Devon | 151 | £285,000 | £262,498 | +8.6% | +24.6% |
| Wareham | Dorset | 147 | £385,000 | £352,500 | +9.2% | +29.4% |
| Sandown | Isle of Wight | 114 | £270,000 | £247,000 | +9.3% | +25.6% |
| Wallasey | Merseyside | 442 | £185,750 | £170,000 | +9.3% | +30.4% |
| Birkenhead | Merseyside | 291 | £143,000 | £130,000 | +10.0% | +31.2% |
| Barton-Upon-Humber | North Lincolnshire | 117 | £205,000 | £185,000 | +10.8% | +22.0% |
| North Shields | Tyne and Wear | 460 | £235,000 | £212,000 | +10.8% | +39.5% |
| Llandudno | Conwy | 209 | £240,000 | £215,000 | +11.6% | +34.1% |
| Broadstairs | Kent | 258 | £375,000 | £329,500 | +13.8% | +13.6% |
| Pwllheli | Gwynedd | 112 | £276,000 | £242,500 | +13.8% | +36.3% |
Download and reuse
The data is yours.
Use it in your own reporting with a credit and a link to this page.
The index
All four series by half-year since 2019, with the unadjusted median and sales count.
coastal_property_index.csv →Seaside towns
All 133 towns with sales, medians and change over one, two and five years.
seaside_towns_prices_H2_2025.csv →Please credit “Coastal Chart Wallpaper, Coastal Property Price Index” and link to www.coastalchartwallpaper.com/coastal-property-prices. Journalists: the press release has the story, tables and contact.
How it is built
Method.
Data
HM Land Registry Price Paid Data, every residential sale in England and Wales from January 2019 (6.2 million sales): standard market sales only, houses and flats, priced between £20,000 and £10 million.
Location
Each sale is placed by its postcode using the ONS Postcode Directory, and its distance from the sea is measured against local authority boundaries. “Coastal” means within 1km of the sea; “inland” means more than 5km.
Second-home hotspots
41 post towns well known for second-home ownership, fixed so the series is comparable over time: Padstow, Wadebridge (Rock and Polzeath), Newquay, Falmouth, Fowey, Looe, Penzance, Hayle, Helston, Bude, Kingsbridge (Salcombe), Dartmouth, Totnes, Sidmouth, Budleigh Salterton, Dawlish, Teignmouth, Braunton, Brixham, Lyme Regis, Bridport, Beaminster, Swanage, Wareham, Southwold, Holt, Cromer, Sheringham, Wells-next-the-Sea, Whitstable, Rye, Bembridge, Whitby, Saltburn, Alnwick, Seahouses, Pwllheli (Abersoch), Tenby, Saundersfoot, Haverfordwest, Pembroke, Milford Haven and Cardigan.
The index
A plain median moves when the mix of what sold changes. The index holds it fixed: within each series the median is worked out separately for detached, semi-detached, terraced and flats, each type’s change since H2 2019 is taken, and the four are combined using the type shares in H2 2019. Town figures are unadjusted medians and are shown with their sales count.
Why half-years
The Land Registry takes two to three months to register a sale, and stamp duty deadlines (March 2021, March 2025) pull thousands of sales into a single month. Half-years published three months after they end are complete and undistorted. The next reading, covering January to June 2026, is published in March 2027.
Credits
Contains HM Land Registry data © Crown copyright and database right 2026. This data is licensed under the Open Government Licence v3.0. Contains OS data © Crown copyright and database right 2026; contains Royal Mail data © Royal Mail copyright and database right 2026; source: Office for National Statistics licensed under the Open Government Licence v3.0.
Why a wallpaper company?
We print a nautical chart of your stretch of coast as a wall mural. The people who buy from us are buying, selling, leaving or dreaming about a place on the coast, and nobody was measuring what those places cost. So we did. See the coasts