Press release · November 2026
Second-home hotspots lose a fifth of their value as council tax doubles
Padstow down 21%, Rye down 17%, Lyme Regis down 15% in the first full six months since the second home council tax premium. Prices in the rest of the country are flat.
House prices in Britain’s best-known second-home towns have fallen sharply since councils doubled council tax on second homes in April 2025, according to a new index of every Land Registry sale on the English and Welsh coast.
The Coastal Property Price Index, published by Coastal Chart Wallpaper, shows the median sale price in 41 second-home hotspots fell 3.1% in the second half of 2025 compared with the same period a year earlier, to £315,000. Over the same period prices more than five kilometres inland were unchanged, and the national market slipped 0.8%.
The falls are concentrated in the towns and counties that moved first on second homes. In Cornwall, where the 100% council tax premium took effect on 1 April 2025, Padstow’s median price fell 20.7% to £457,500, Newquay and Falmouth both fell 6.3% and Bude fell 4.9%. In North Norfolk, which introduced its premium the same day, Holt fell 13.9%, Sheringham 11.7% and Cromer 2.6%. Rye in East Sussex fell 16.6% to £365,000 and Lyme Regis in Dorset fell 14.6% to £505,000.
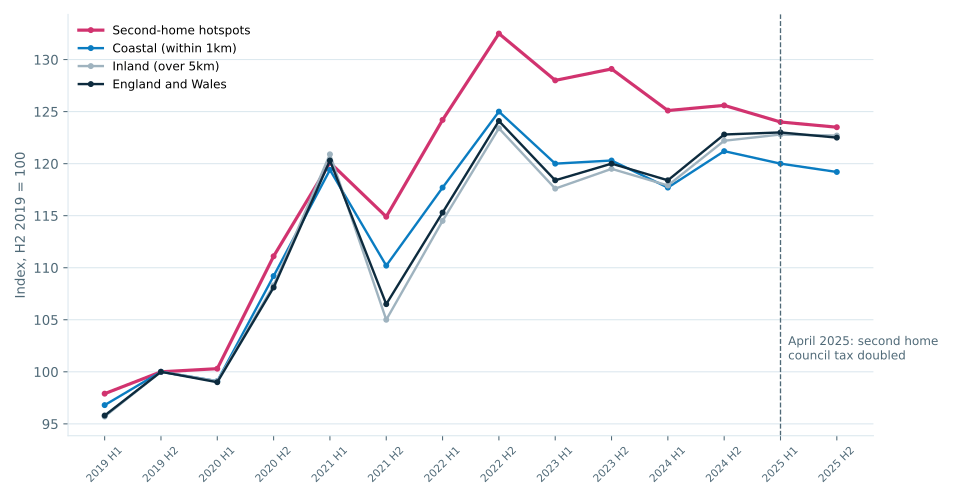
The index, which holds the mix of property types constant, shows second-home hotspots peaked in late 2022 at 32.5% above their pre-pandemic level and have since given back nine points, while England and Wales as a whole stands within half a point of its all-time high. The gap between hotspot prices and the national market has closed from 8.4 points to 1.0.
The second half of 2025 is the first full six-month period since two changes hit second-home owners at once: the council tax premium of up to 100% that English councils could charge from 1 April 2025, adopted by most coastal authorities, and the abolition of the furnished holiday lettings tax regime on 6 April 2025.
Wales offers a glimpse of what may come next. Gwynedd introduced a 150% premium in April 2023, two years ahead of England. Pwllheli, which includes Abersoch, fell 8% over two years and has now turned: prices rose 13.8% in the second half of 2025.
A spokesperson for Coastal Chart Wallpaper said: “Everyone has a view on second homes, but until now nobody had measured what happened to prices once the premium came in. We built the index because the coast is what we do, and the answer is clear: in the towns people argue about most, prices are falling while the rest of the country stands still. Whether that is good news depends on whether you are buying or selling, but it is the first real evidence that the policy is biting.”
Biggest falls in second-home hotspots, H2 2025 vs H2 2024
| Town | County | Median H2 2025 | Change | Sales |
|---|---|---|---|---|
| Bembridge | Isle of Wight | £322,500 | -34.2% | 38 |
| Padstow | Cornwall | £457,500 | -20.7% | 32 |
| Rye | East Sussex | £365,000 | -16.6% | 125 |
| Lyme Regis | Dorset | £505,000 | -14.6% | 46 |
| Holt | Norfolk | £352,000 | -13.9% | 93 |
| Cardigan | Ceredigion | £220,000 | -12.0% | 97 |
| Sheringham | Norfolk | £302,500 | -11.7% | 71 |
| Milford Haven | Pembrokeshire | £170,000 | -10.5% | 146 |
| Alnwick | Northumberland | £285,000 | -9.4% | 143 |
| Pembroke | Pembrokeshire | £210,000 | -6.7% | 72 |
| Newquay | Cornwall | £315,000 | -6.3% | 401 |
The index, H2 2019 = 100
| Peak (H2 2022) | H2 2024 | H2 2025 | Change on year | |
|---|---|---|---|---|
| Second-home hotspots | 132.5 | 125.6 | 123.5 | -1.7% |
| Coastal (within 1km) | 125.0 | 121.2 | 119.2 | -1.7% |
| Inland (over 5km) | 123.4 | 122.2 | 122.7 | +0.4% |
| England and Wales | 124.1 | 122.8 | 122.5 | -0.2% |
The full index, the 133-town seaside league table, the method and the data to download are at www.coastalchartwallpaper.com/coastal-property-prices.
ENDS
Notes to editors
- About the index. The Coastal Property Price Index is built from HM Land Registry Price Paid Data covering every residential sale in England and Wales since 2019 (6.2 million transactions). Each sale is located using its postcode and the ONS Postcode Directory, and its distance from the sea is measured against local authority boundaries. The index is published every six months, with the base of 100 set at the second half of 2019.
- Four series. Homes within 1km of the sea; 41 named second-home hotspot towns; homes more than 5km inland; and all of England and Wales. Index values are adjusted for the mix of property types sold using fixed 2019 weights. Town figures are unadjusted median sale prices and are shown with the number of sales.
- Why July to December. The stamp duty deadline of 31 March 2025 pulled 124,000 sales into a single month, so comparisons of the year to March are distorted. July to December 2025 is the first complete, undistorted six months since the second home council tax premium and the end of the furnished holiday lettings regime, both in April 2025.
- Small towns. Medians in towns with under 50 sales a half-year can move on a handful of transactions. Padstow (32 sales), Lyme Regis (46) and Southwold (44) should be read alongside the pooled hotspot figure.
- Data and licensing. Contains HM Land Registry data © Crown copyright and database right 2026, licensed under the Open Government Licence v3.0. Postcode data: Contains OS data © Crown copyright and database right 2026; contains Royal Mail data © Royal Mail copyright and database right 2026; source: Office for National Statistics licensed under the Open Government Licence v3.0.
- About Coastal Chart Wallpaper. Coastal Chart Wallpaper makes made-to-measure wall murals from nautical charts of the British and Irish coast, for people who want their stretch of coast on their wall. www.coastalchartwallpaper.com
- Contact. Use the contact form, marked press, and we will come back the same day. Spreadsheets of the full town table and index series are on the data page.